R10Progress: Advanced Golf Analytics for Garmin R10 Users
Looking for better insights from your Garmin R10 launch monitor? My free, open-source golf analytics platform transforms raw data into actionable improvements for your game.
Why Garmin R10 Users Need Better Golf Analytics
As a fellow Garmin R10 user, I found the standard app's analytics too limited for serious improvement. That's why I created R10Progress - a comprehensive golf data analysis tool designed specifically for Garmin R10 users who want to take their game to the next level.
Unlike corporate golf software, R10Progress is a passion project built by me, a golfer, for other golfers. The open-source approach means the entire golf community can contribute to making it even better!
Join the R10Progress subreddit to connect with other users, share insights, and get the most from your R10Progress experience.
Essential Golf Analytics Features for Garmin R10 Users
I've designed R10Progress to transform your Garmin R10 data into meaningful insights with powerful visualization tools, progress tracking, and detailed analytics - all presented in golfer-friendly language without the technical jargon.
Visual Shot Analysis
Transform raw Garmin R10 data into intuitive visual representations
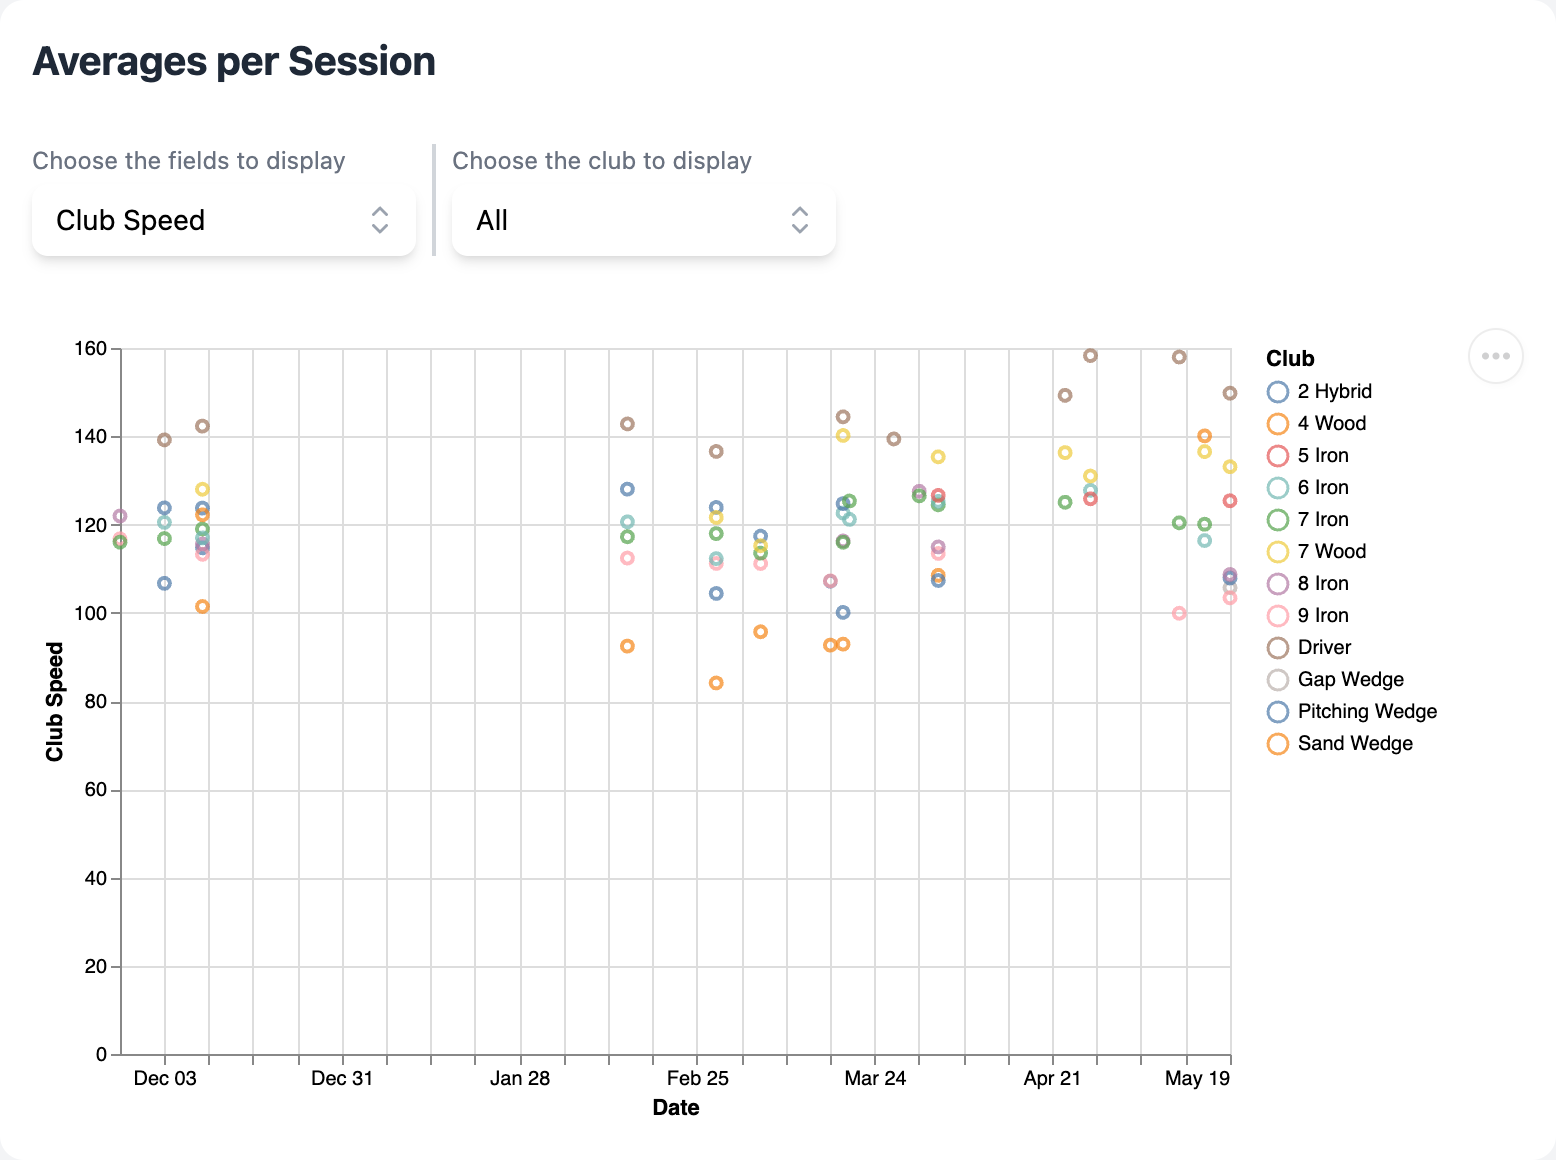
Golf Performance Tracking
Monitor your improvement with detailed metrics over time
Club Comparison Analytics
Identify your strongest and weakest clubs with data-driven insights
Personalized Golf Goals
Set and track achievable targets based on your actual performance
Swing Pattern Recognition
Identify the root causes of common swing issues like slices and hooks
Golf Session Dashboard
Compare your latest range session against your historical performance with my intuitive dashboard. Spot trends and improvements without needing to be a statistics expert.
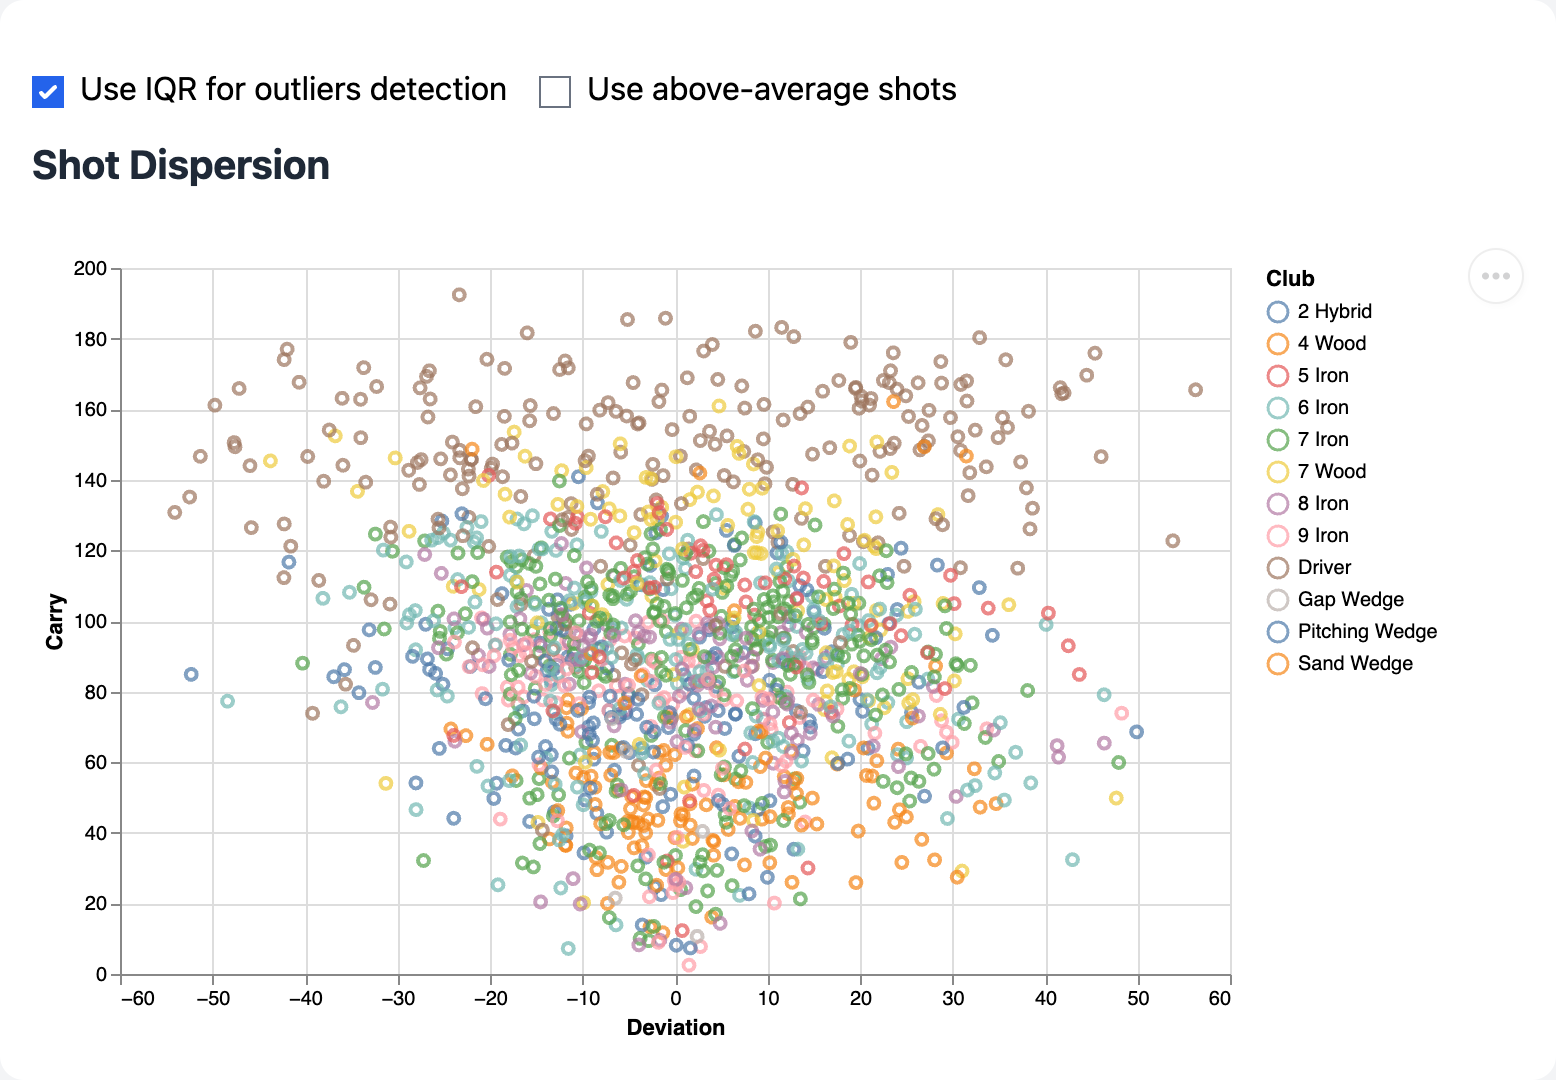
Golf Shot Dispersion Analysis
Visualize exactly where your shots land with detailed dispersion patterns for each club. Gain insights into your consistency and accuracy that the standard Garmin app doesn't provide.
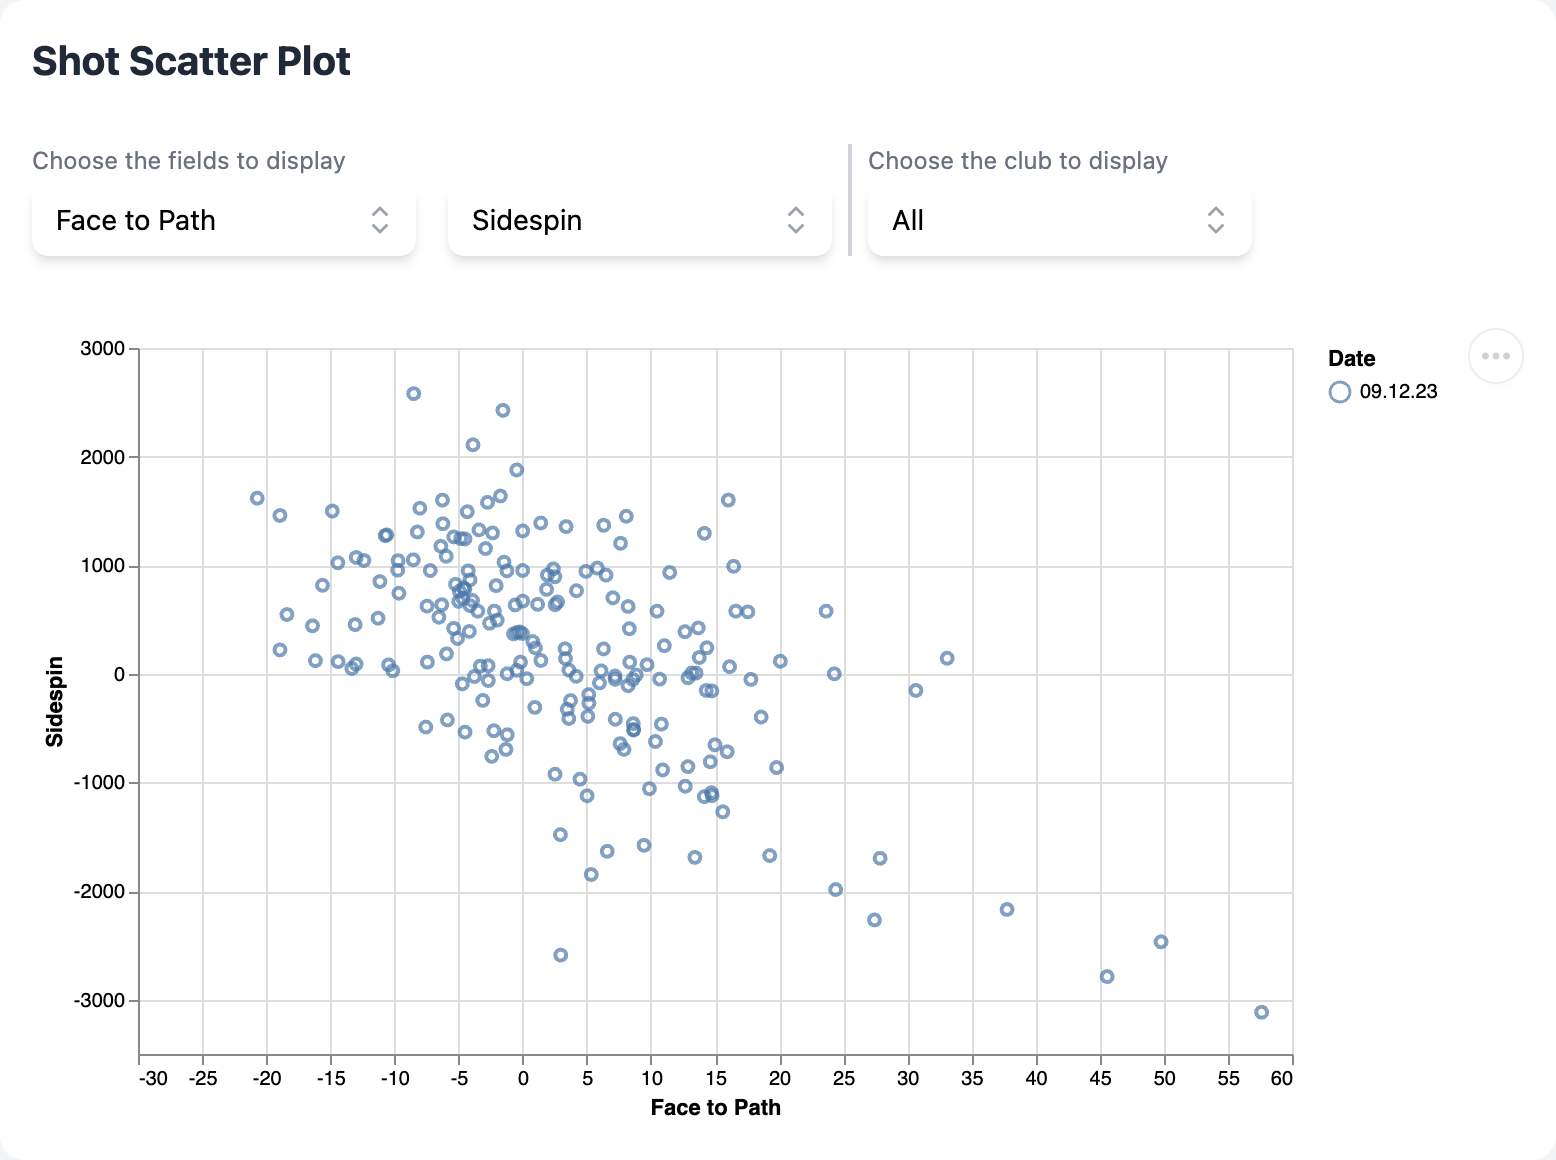
Golf Swing Correlation Analysis
Discover the relationships between different aspects of your golf swing. Learn whether increasing club head speed actually improves your distance, and other crucial insights for game improvement.
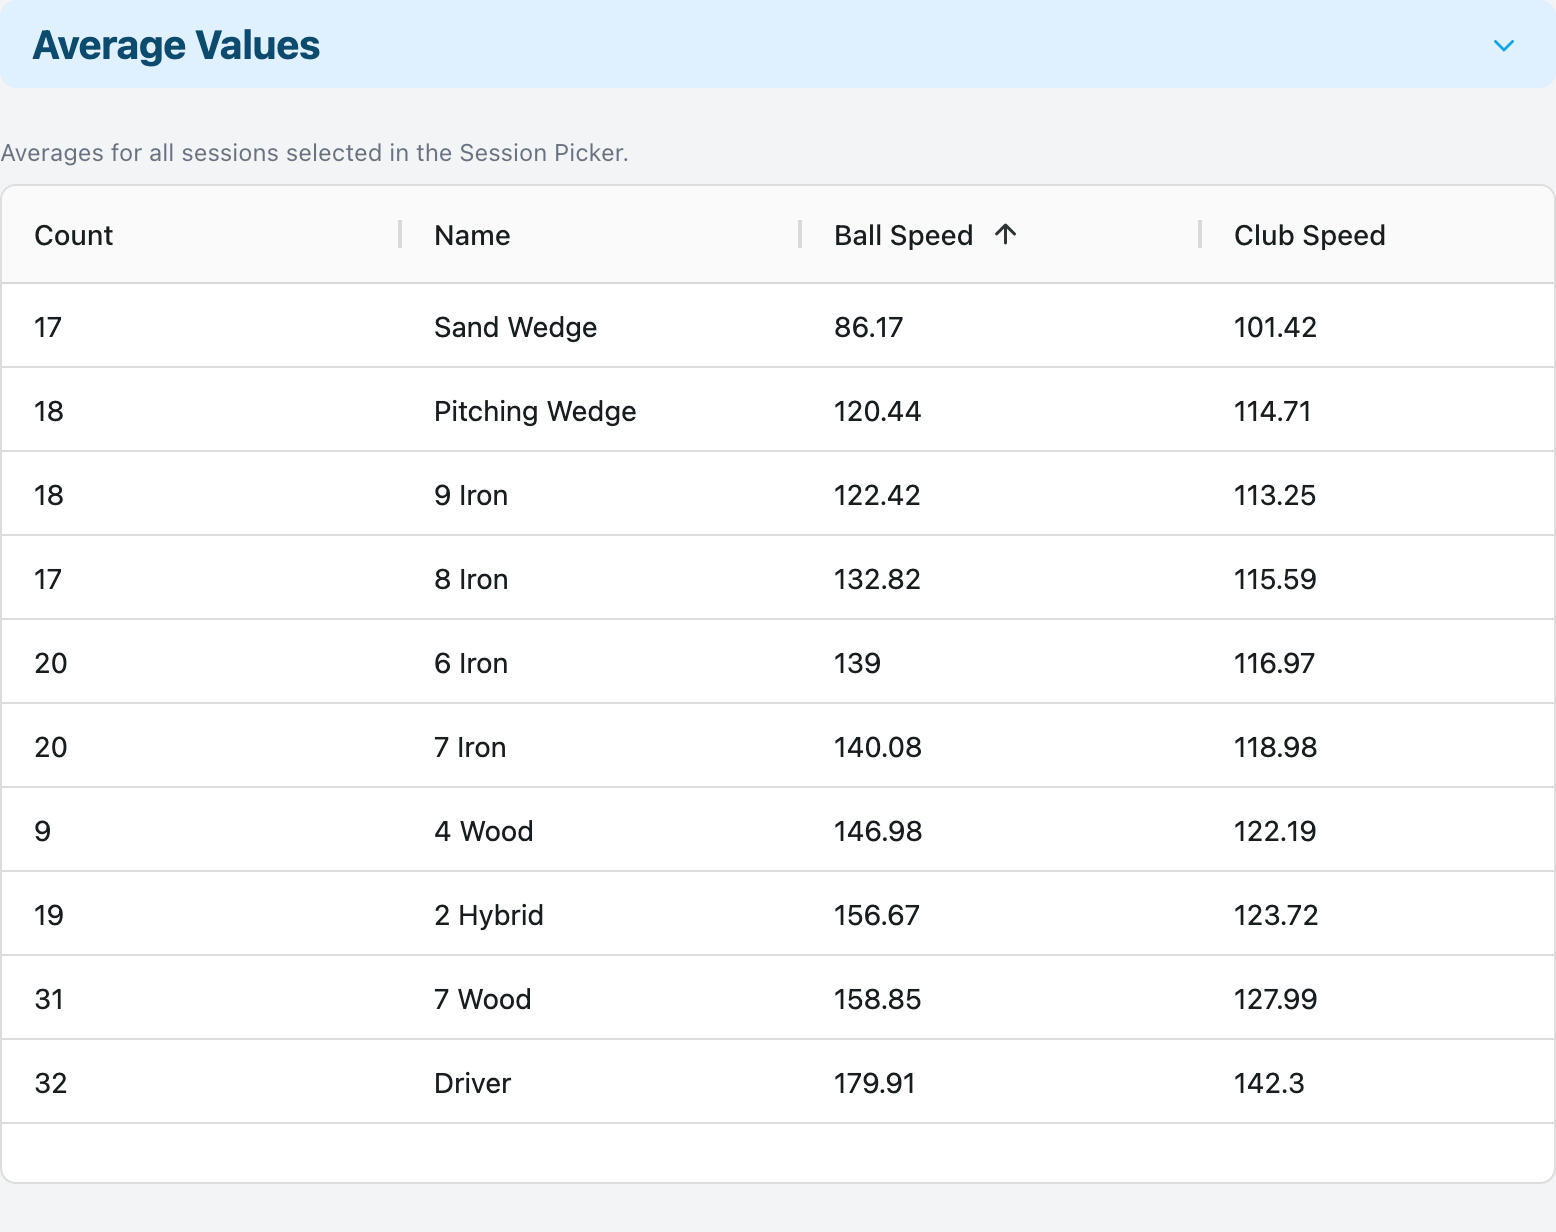
Comprehensive Golf Data Organization
Access all your Garmin R10 shot data in one centralized location, with powerful sorting and filtering options. Perfect for detailed analysis or sharing progress with your golf instructor.
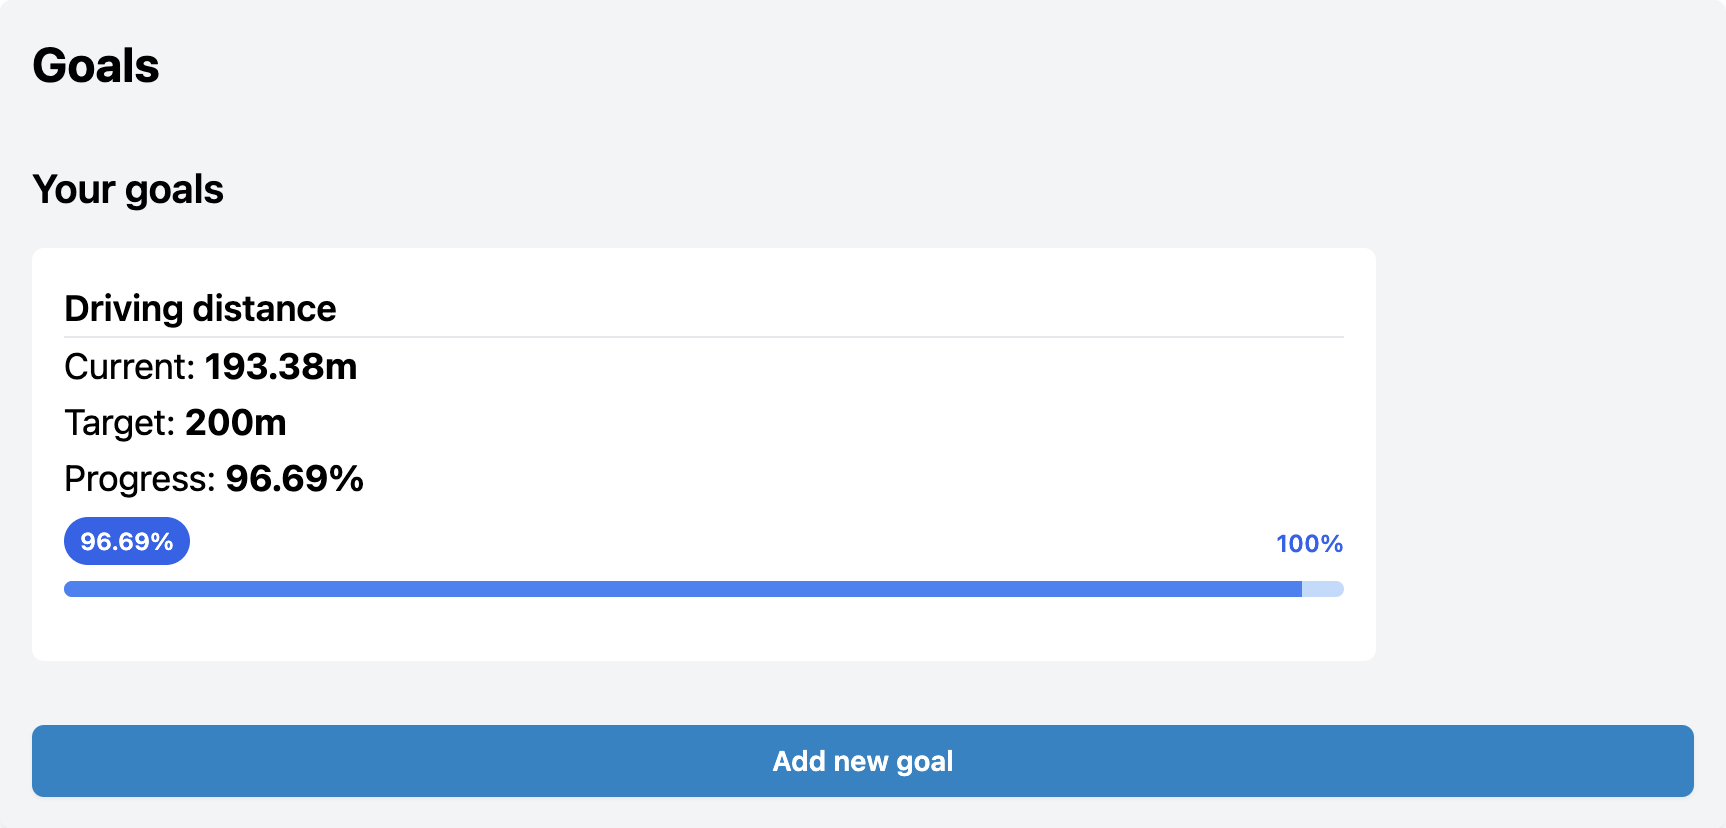
Golf Improvement Goal Tracking
Set realistic, data-driven golf improvement goals based on your actual performance metrics. Track your progress over time and celebrate meaningful achievements in your golf journey.
Multi-Language Support for Garmin R10 Users Worldwide
R10Progress currently supports Garmin Golf .csv files exported in English, Spanish, and German. This means you can analyze your golf data regardless of your device's language settings.
Need Support for Another Language?
I'm happy to add support for additional languages! Simply send me an example .csv file from your Garmin Golf app, and I'll expand the compatibility to include your language.
AI-Powered Golf Swing Analysis for Garmin R10 Users
Take your golf game even further with my AI-powered swing analysis that provides personalized tips based on your unique Garmin R10 data patterns. This advanced feature delivers insights similar to what you'd get from a professional golf coach.
The AI analysis feature is available for a small donation (about $5, the price of a coffee) to help cover the API costs while keeping the core R10Progress platform completely free for all golfers.
100% Optional Enhancement
All core R10Progress golf analytics features remain completely free forever. The AI analysis is simply an additional tool for those wanting even deeper insights.
Continuous Improvement for Garmin R10 Analytics
I'm constantly evolving R10Progress with new features and improvements based on feedback from the community of Garmin R10 users. The open-source approach means anyone can contribute ideas or code!
Start Improving Your Golf Game with R10Progress Today
Join hundreds of Garmin R10 users who are transforming their golf game with this free, comprehensive analytics platform. No subscriptions, no hidden fees.
Analyze Your Garmin R10 Data NowDeveloped with ❤️ by a passionate golfer just like you